Road Safety:
Wide area 20mph limits have been shown to deliver no casualty reductions [Ref.1]. Instead, they increase pedestrian death and serious injury risk; through increased pedestrian incaution, coupled with increased driver distraction and workload occasioned by the increased need to speedometer-watch. Birmingham City Council Councillors should, as a consequence, be jointly and severally sued by victim’s families for dereliction of duty of care to protect citizens’ well-being; as they will have been instrumental in increasing road danger.
Air Quality:
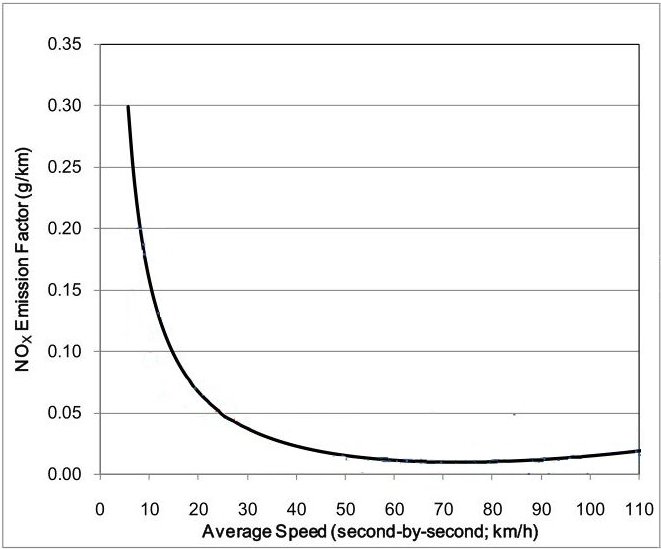
Anyone with any engineering background – which Birmingham City Councillors apparently lack – knows that lower speeds mean selection of lower gears, which in turn means dramatically increased emissions [see immediately below and Ref. 2]
Local Economy:
Every 1mph reduction in average traffic speed costs the economy over 1 Billion per annum in lost productive time, caused by increased journey times.
With each 20mph journey taking up to 50% longer than the same journey travelling at 30mph, Birmingham City Council may as well read the Last Rites over the Birmingham local economy. This, at a time when Britain needs to leverage every economic advantage, as we deal with the process of leaving the European Union.
Unless of course, it is also Birmingham City Council’s desire to obstruct the nation’s democratically-expressed wishes?
Since these proposals will deliver precisely none of their alleged advantages, but three major and very evident disadvantages, it is clearly in the best interests of the city’s citizens to implacably oppose them.
References:
1. 20mph Research Study Highlight & Full Reports to DfT by Atkins, AECOM & Prof. Mike Maher, UCL, November 2018.
2. London Exhaust Emissions Study – Developing a test programme and analysis of emissions data from passenger cars in London”, Transport for London; graphs on pages 18-31.