Most living systems on Earth are composed of combinations of the elements carbon, hydrogen, oxygen, (and trace quantities of) nitrogen, phosphorus and sulphur. Life is predominantly sustained by carbon dioxide and water. Plants absorb carbon dioxide, thereby creating complex carbohydrates by photosynthesis, and transpire oxygen. Animal life eats plants (and/ or each other). Controlled oxidation (by oxygen gained from respiration processes) of ingested proteins and carbohydrates provides the energy needed by animals to survive. The animals exhale carbon dioxide – which plants absorb – perpetuating the plant-animal life cycle.
Certain special interest groups, (which unsurprisingly stand to profit financially and/ or politically from the measures they propose) advocate drastic action to offset a range of hysterically hyped climate threats. Amongst these alleged threats are: uncontrollable average global temperature rise, rapidly receding glaciers, oceanic acidification, rising sea levels, extreme weather incidents etc. etc. All these are allegedly caused by rising levels of the essential, life-sustaining, atmospheric trace gas carbon dioxide.
Not one of these scare stories is true [Refs. 1, 2, 3, 4]. The atmosphere is a closed, gravity-contained system (or it would all have evaporated into outer space). Of the gaseous atmospheric components: nitrogen, oxygen, water (as vapour), inert gases argon, helium, neon etc….only one: water, is capable of existing in all three of its phases (solid, liquid and vapour) under the temperatures and pressures that prevail in our atmosphere. All the rest remain gaseous at all times.
Since carbon dioxide levels have been rising in this closed system in recent decades (which no-one disputes), Le Chatelier’s Principle of Dynamic Equilibrium Force [Ref. 3] applies. As more carbon dioxide enters the atmosphere, there is only one component that can be displaced from it. Water vapour condenses predominantly to form liquid water, resulting in increased cloud cover. Since water vapour is the most abundant and most potent global warming gas [Ref. 4], any warming from increased atmospheric carbon dioxide levels is counteracted by decreased water vapour concentration and increased (cooling) cloud cover. This is independent of the extraterrestrial cosmic ray incidence-driven cloud formation mechanism covered amongst the references below.
The Earth has for the last 11,000 years been in an Interglacial period – literally between Ice Ages. Within the current Interglacial, there have been periods of increasing and diminished warming: e.g., the Minoan-, Roman-, Medieval-, and Modern Warm Periods, the Little Ice Age etc [Ref. 5,6].
All of these climate phenomena are perfectly explicable, assuming the primary influences on our climate to be solar radiative and magnetic activity, our cosmic ray environment and consequent cloud albedo, solar-orbital and tectonic factors [Ref. 7, 8, 9]. Meanwhile, predictions from grossly inaccurate IPCC Global Circulation climate models consistently substantially overestimate future temperatures when compared with real-world measurements [Ref 10].
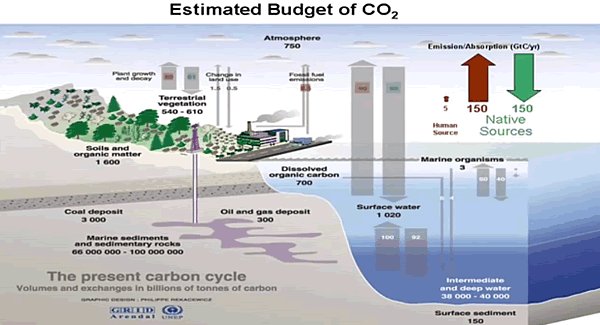
Atmospheric carbon dioxide only comprises 0.04% of the atmosphere [Ref. 11]. Mankind’s activities make only a c.3% contribution to its atmospheric concentration; with the UK’s Man-made carbon dioxide emissions being only 1% of the global Man-made total [Ref. 12]. Fully 97% of total annual global carbon dioxide emissions arise from natural sources [Ref. 13]. Carbon dioxide is also essential for terrestrial plant life – and hence all life on Earth – to survive [Ref. 14]. The buffer effect of carbon locked up jointly in the oceanosphere and fossils (55,000 Gt) massively outweighs atmospheric carbon dioxide (800Gt) [Ref.15]; so any suggestion of its redissolution meaningfully acidifying the oceans is facile.
Over geological timescales, the correlation between atmospheric carbon dioxide levels and temperature is poor [Ref.16]. Over millennial timescales, atmospheric carbon dioxide levels can sometimes track global temperature changes; but with a 800+/-200 year lag – due to the time the Earth’s oceans take to respond to warming or cooling generated by the various, primarily extraterrestrial factors outlined above. So its influence is relatively insignificant [Refs. 16, 17].
The bulk of the observed recent warming – which is neither unprecedented nor a cause for concern – predominantly occurred in the 1930’s to 1940’s – and largely ceased over two decades ago. Cooling has now begun as we enter a pronounced solar activity minimum [Ref. 18]. This has disrupted the previous, stable jet-stream conditions (which prevail in periods of strong solar activity). Now different parts of the Earth can at the same time experience hot, arid conditions leading to e.g., extensive Australian bushfires; while other areas suffer (record-breakingly) intense cold Winter conditions (across large parts of Canada, North America and Asia) [Refs. 19, 20, 21]; all of which goes largely unreported by the world’s media, as it does not fit the monotonic warming narrative. So it may be appropriate to prepare for several decades of steadily intensifying cold, not warming.
The eminent climate scientist, Judith Curry, has recently released what she considers realistic mean surface temperature change scenarios for the 2020 to 2050 period, based on a semi-empirical data (i.e., on real-world observations, as opposed to unrealistic computer models). All three sources of natural climate variability: solar, volcanoes and internal (ocean circulation etc) are expected to act in the direction of cooling during this period [Ref. 22].
Some final observations. The positive feedback water vapour amplification of carbon dioxide atmospheric warming concept proposed by the IPCC is theoretical and unproven. It is considered completely incorrect by some researchers [Ref. 23]. Indeed, there is an alternative, and quite plausible, explanation for the so-called “greenhouse” phenomenon. This suggests it is purely a result of the compressive effect of gravity on all the gases in the atmosphere, and would manifest itself whatever the composition of the terrestrial atmosphere [Ref. 24].
So next time an eco-zealot Climate Liar or clueless vote-seeking politician tells you that you have to be taxed more and give up your freedom of mobility to “save the planet”, tell them to consult some real scientists’ about the forces that influence our ever-changing climate. Tell the politicians to bus-, cycle-, or walk off (which, of course, they will – in their taxpayer-provided limousine…). And tell them that they won’t be getting your vote next time round. Better to be labelled a climate denier than to be a Climate Liar.
References:
1. https://arxiv.org/abs/0707.1161
2. https://www.heartland.org/_template-assets/documents/CCR/CCR-I-Executive-Summary.pdf
3 Le Chatelier’s Principle can be roughly stated as: “When an external constraint is applied to any system at equilibrium, the system responds so as to remove the effect of that constraint”. See: https://chemguide.co.uk/physical/equilibria/lechatelier.html
5. https://electroverse.net/younger-dryas-rewind-and-repeat/
7. http://joannenova.com.au/2010/02/the-big-picture-65-million-years-of-temperature-swings/
8. https://www.naturalnews.com/2019-07-12-climate-change-hoax-collapses-new-science-cloud-cover.html
9. https://twitter.com/NikolovScience/status/1219874495004995584
10. https://www.drroyspencer.com/2014/02/95-of-climate-models-agree-the-observations-must-be-wrong/
11. {ABD – CO2 sources graphic attached}https://home-5010050506.webspace-host.com/wordpress/wp-content/uploads/2020/02/co2-budget.jpg
12. {Man-made sources by country graphic}: https://www.ucsusa.org/resources/each-countrys-share-co2-emissions
14. https://www.facebook.com/photo.php?fbid=2713989568624612&set=p.2713989568624612&type=3&theater
15. {Global Carbon Pools Graphic}; https://rclutz.wordpress.com/2017/11/17/co2-fluxes-sources-and-sinks/
16. http://www.biocab.org/Carbon_Dioxide_Geological_Timescale.html
19. https://electroverse.net/b-c-is-about-to-be-colder-than-its-ever-been-in-over-a-century/
20. https://electroverse.net/rare-and-heavy-snow-covers-sinai-peninsula/
21. https://electroverse.net/pakistan-and-afghanistan-death-toll-surpasses-200/
22. https://judithcurry.com/2020/02/13/plausible-scenarios-for-climate-change-2020-2050/
23. https://groups.google.com/forum/#!topic/sci.environment/4nJoUT32IN8
You are peddling bad information. Check today’s temperatures: https://twitter.com/DrShepherd2013/status/1549130974113533959/photo/1